
WQData LIVE Web Datacenter
Collect, store and share environmental data with the industry's most advanced web datacenter.
Features

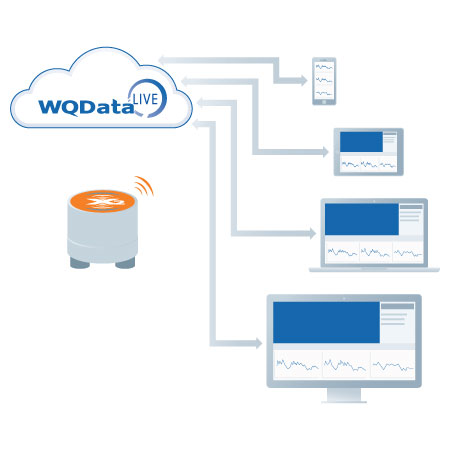
Automate Device-to-Cloud
Web-enabled data loggers automatically connect and stream data to WQData LIVE. Data is stored in the cloud and can be accessed from any PC or mobile device. Two-way communication allows the user to quickly configure settings or troubleshoot communications from anywhere.

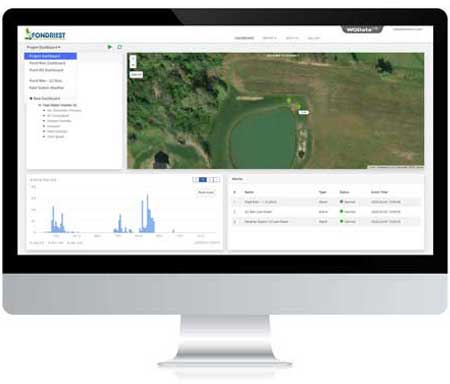
Customize and share
Setup one or multiple dashboards, or customize default dashboards to optimize data display. Cycle dashboards automatically or setup a single long-format scrollable display.

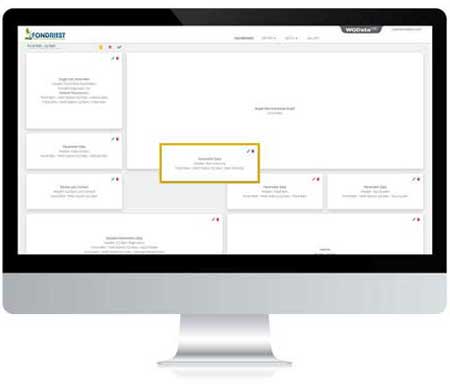
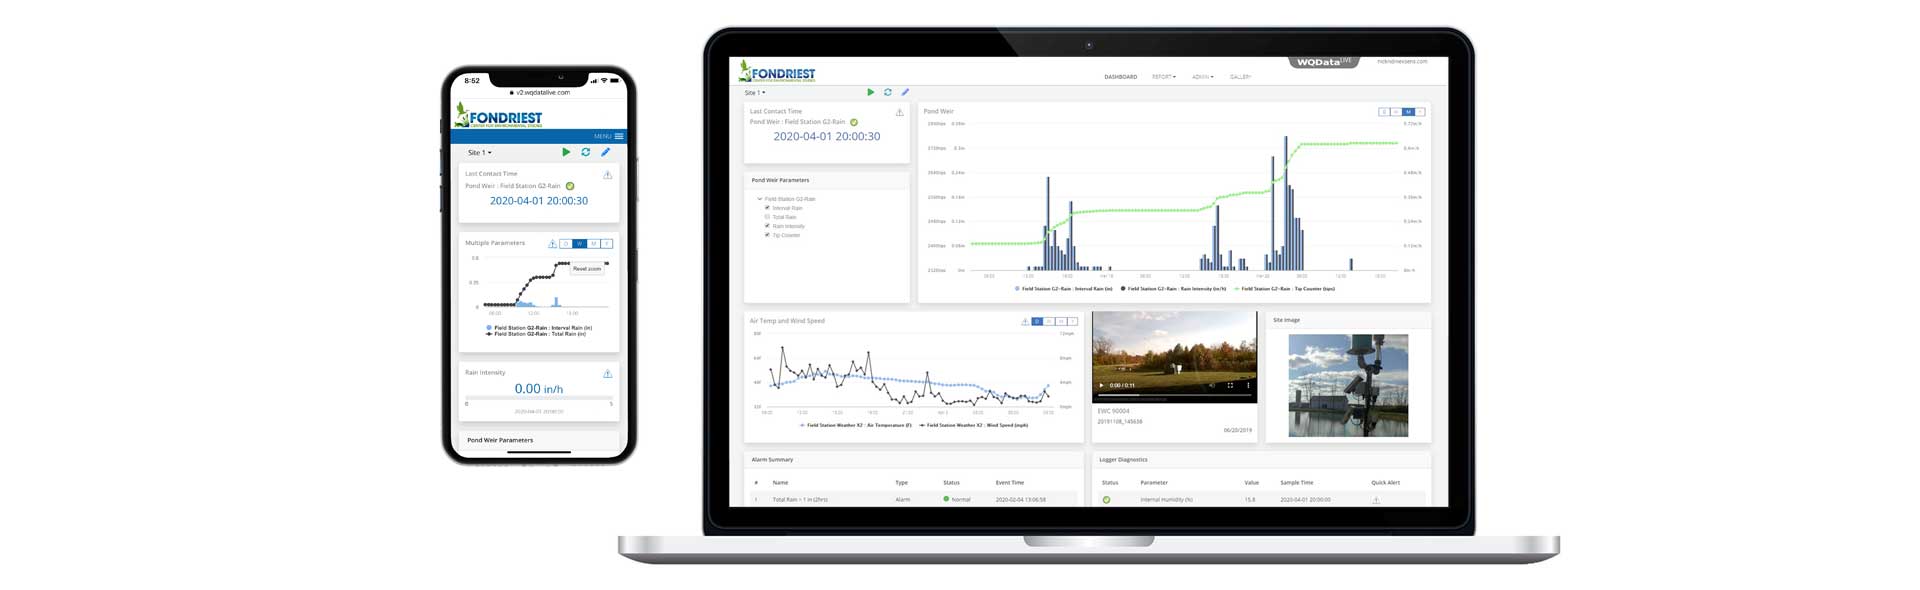
Arrange panels for custom display
Dashboards are easily customized to suit project needs. Select the edit icon (pencil), drag and drop panels and position as desired. You can also select from a wide variety of standard panels including map, site/device list, live video, project photo, graphs, single parameter data display, project description, data disclaimer, alarms and more…

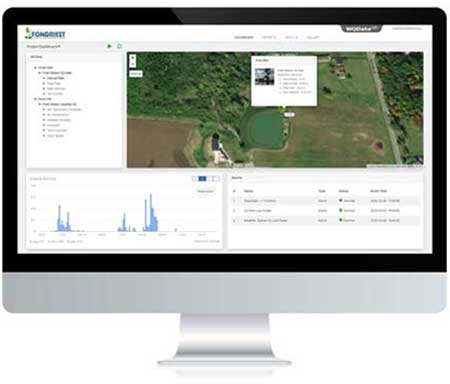
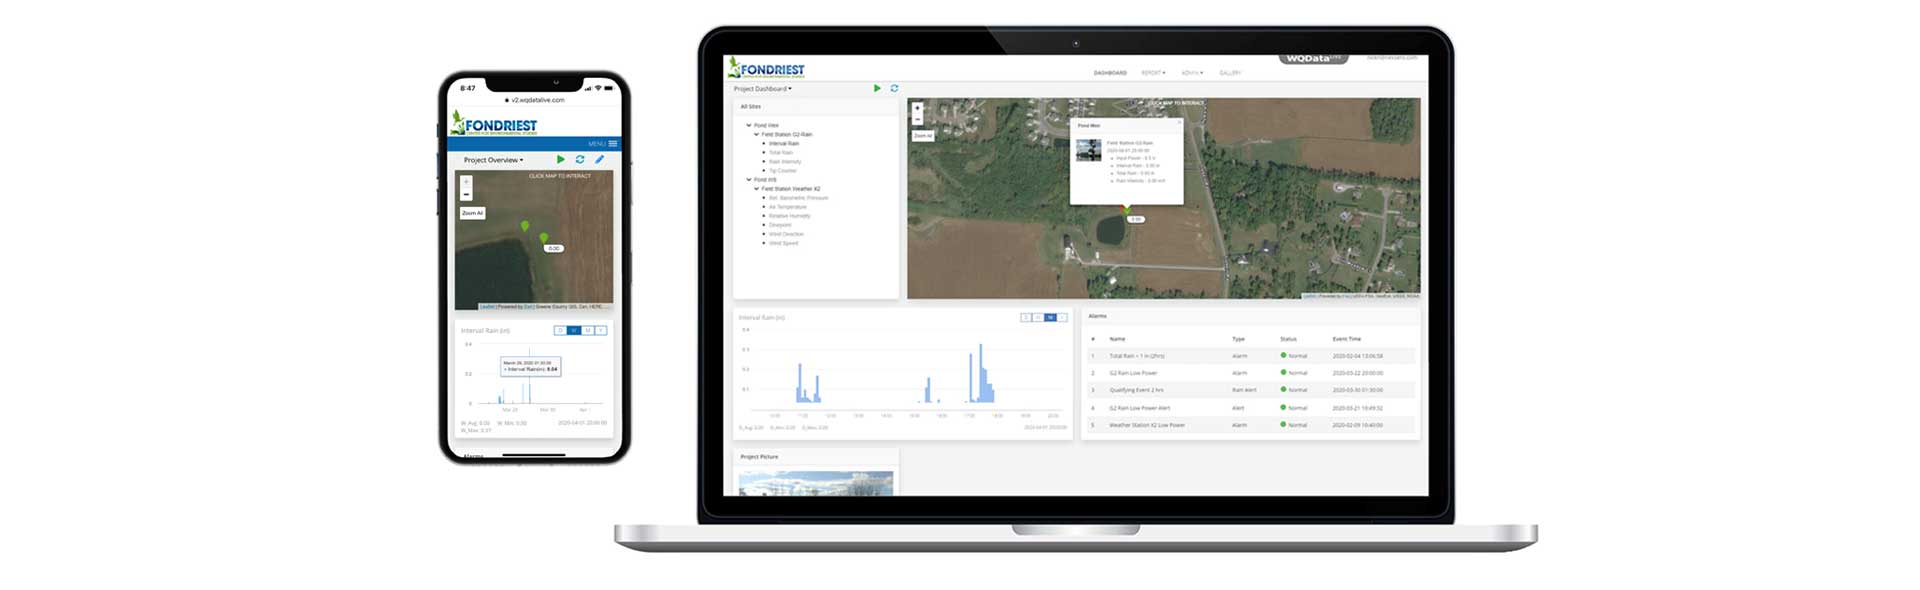
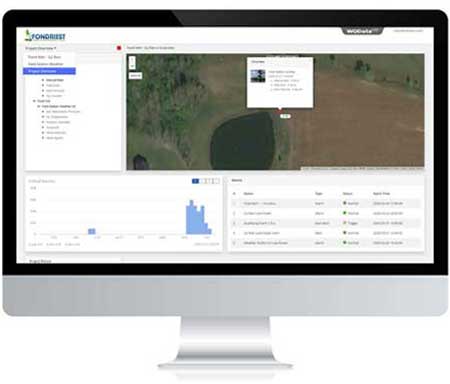
View projects on interactive maps
ESRI Leaflet maps are displayed with markers accurately locating project sites and when clicked, parameter data and photos are available directly on maps. Alarm conditions illuminate the site object and highlight ‘alike’ parameter readings across the entire project.

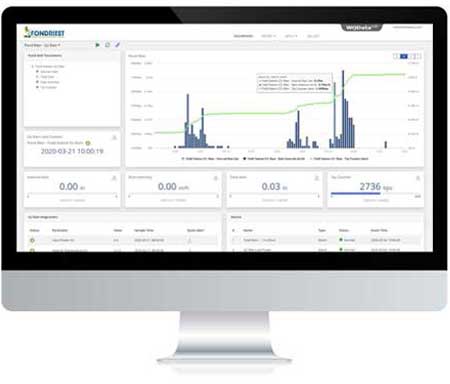
View trends on interactive graph
Single and multi-traces graphs are interactive. Select the parameters to be graphed on the site list or map. Select day, month, week, or year. Zoom to specific events and reset for a full-time period.
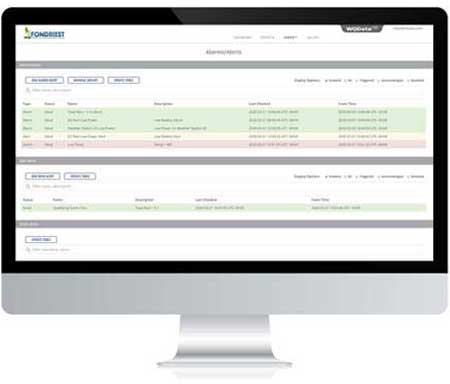

Monitor and control alarms
The system monitors alarm conditions on parameter readings at a single site or across multiple sites in a project. Automatic and manual resets provide convenient control. Actions include email notification or smartphone push notifications when using the available app.

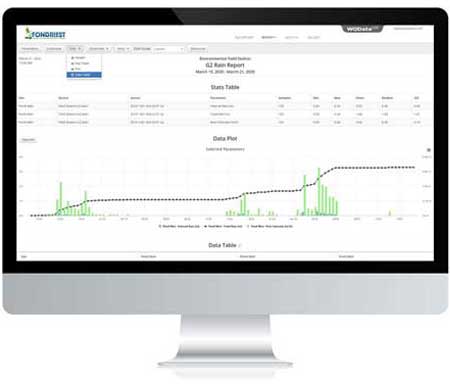
Create graphical, statistical and data reports
Pre-built report templates create new multi-site, multi-parameter reports. Charts, statistics, data tables, field notes and more are presented in easy to understand reports that are easy to share. Post to an FTP site, email, create PDF files and download to spreadsheets.

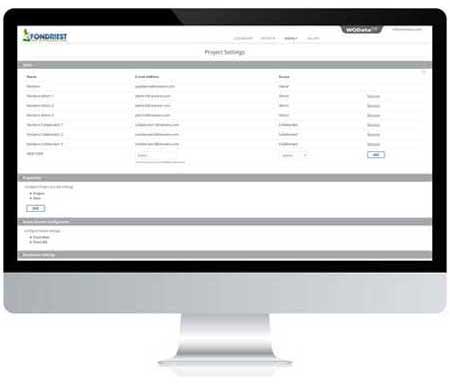
Encourage team collaboration
WQData LIVE is set up to promote collaboration without risk of data loss or accidental system configuration changes. The project administrator invites collaborators and assigns privileges. Collaborators have access to most of the functionality including dashboard, reports, media gallery, alerts, and more.

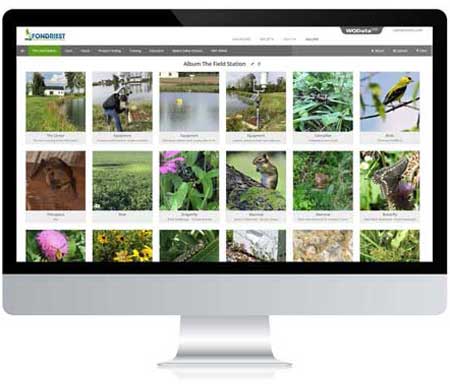
Store and share visuals in the Media Gallery
Upload project or site photos to the cloud for display in the media gallery. Connect an environmental web camera to the NexSens X2 data logger for photo and video upload in sync with parameter readings.

Share with the larger group of stakeholders
WQData LIVE’s public portal makes data available for open web publishing. Interested viewers only see data that you select. An independent URL can be setup for projects. The slide show feature shares a project overview, maps, photos, data, plots and more. Viewers can enable parameter notifications pushed to a mobile device when parameter limits are exceeded.

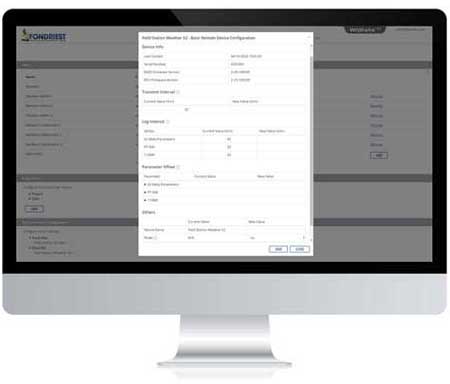
Remote Configuration
No need for a site visit to make configuration changes. Queue the commands online and the remote data logger will be configured on the next transmission connection.

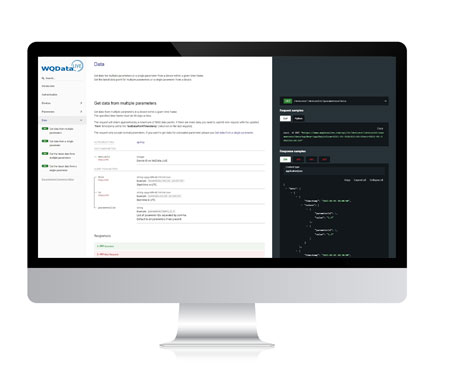
Application Programming Interface
A fully documented application programming interface (API) provides direct access to real-time data for export to external databases, sharing on websites, etc. Learn more at WQData LIVE Data API Doc.
Plans
Case Studies

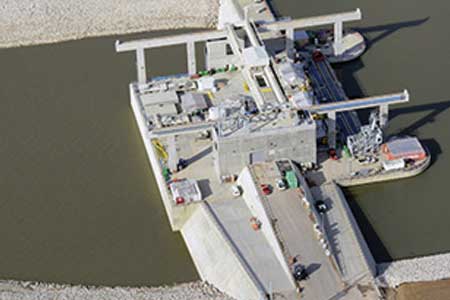
Cannelton Dam Hydroelectric Project
At six different sites along the Ohio River, American Municipal Power, Inc. (AMP) is retrofitting existing locks and dams operated by the U.S. Army Corps of Engineers to generate environmentally friendly hydropower. Many of these projects have broken ground over recent years, but the first to get underway was at Cannelton Locks and Dam, located along the Ohio River near Cannelton, Indiana. Work to retrofit the dam commenced in 2010, […]
Read More →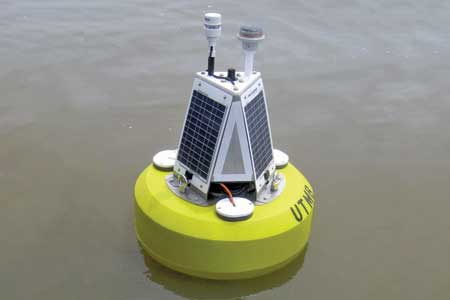

Maumee Bay Algae Monitoring
In order to protect the millions of people who rely on Lake Erie for drinking water from the threat of harmful algal blooms in its water, nearby universities and state agencies have coordinated monitoring efforts to better predict the presence of algal toxins. Their work has helped expand a network of data buoys in the great lake that keep an eye on water quality with an aim to avoid another […]
Read More →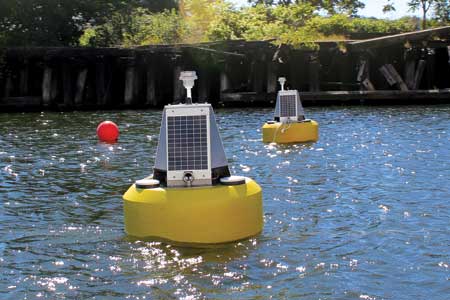

Buffalo River Dredge Turbidity Monitoring
New York’s Buffalo River has a legacy of industrial contamination, like a lot of other Great Lakes rivers and harbors. But its past of sustaining large influxes of industrial effluent has netted it the distinction of being named a Great Lakes Area of Concern. With its dirty legacy flowing right through their backyard, environmental groups near the river, including the Buffalo Niagara RiverKeeper, began work to bring it back to […]
Read More →